

 Previous
LEAVE A REPLY
Your email address will not be published.Required fields are marked *

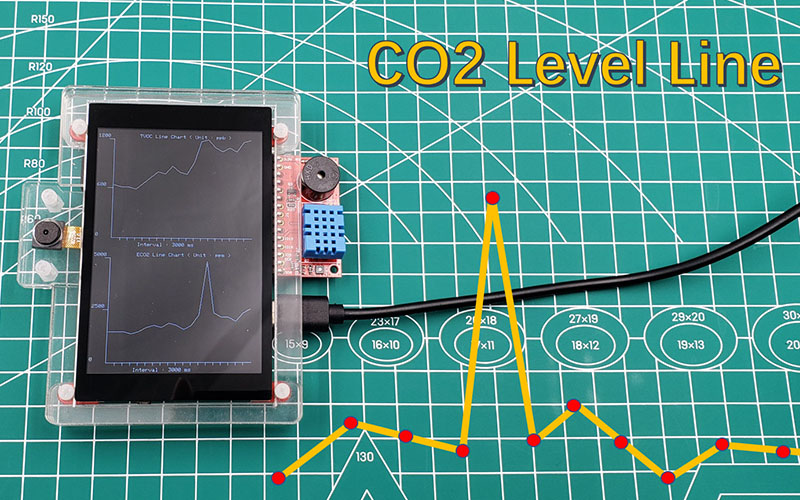
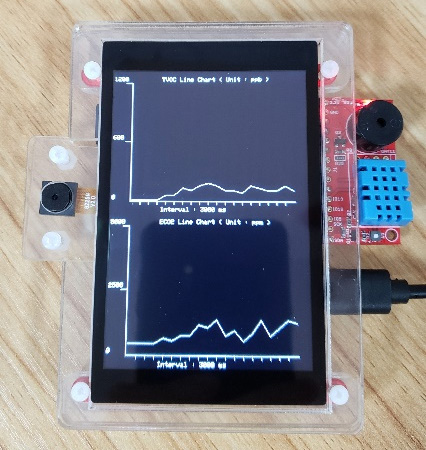
In this project, we will Display CO2 Level Curve with ESP32, using the indoor environment board and ESP32 3.5 inch TFT touch screen.
For a parameter that is very easy to cause change with a significant range, it makes no meaning to check the level at a certain moment. Like the CO2 level, a very high concentration may be reached at this moment, but it may return to normal in the next moment in a certain area. Usual the temperature and humidity in the air are measured by checking the current value, but the CO2 concentration measurement is different. It is the level obtained by measuring the concentration in a certain space with the sensor, which there are too many factors affected: wind, people breathing, temperature, humidity and so on.
Once I had made a project about the CO2 monitor that had such a problem. Now I have a point to make it better—record the history level.
1. Materials
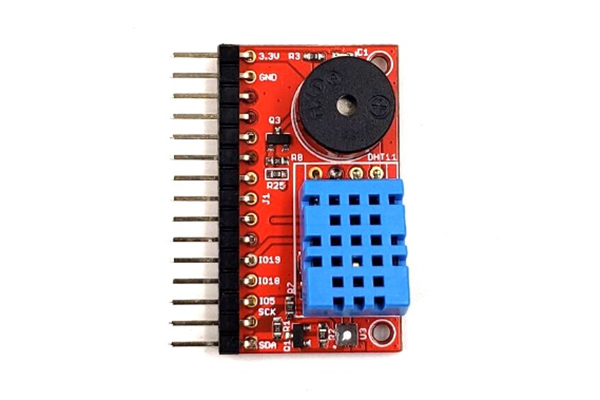
1. Indoor Environment Expansion Board
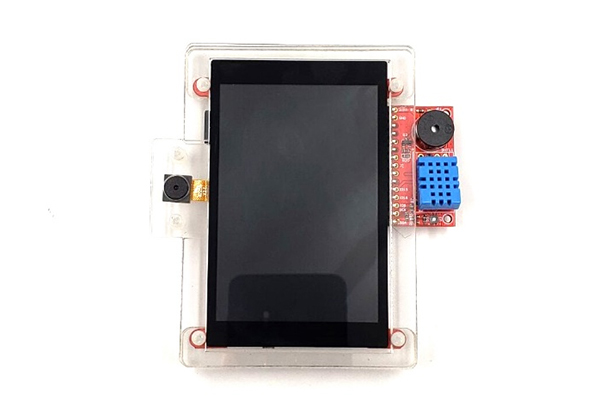
2. ESP32 3.5 Inch TFT Touch Screen
As the last project Monitor CO2 and TVOC With ESP32, I also used the SGP30 sensor to measure the CO2 concentration level. in order to convenient, I use the indoor environment board. This board base on the SGP30, also integrated the DHT11 module on board for measuring the temperature and humidity. Besides there is a buzzer on board for warning. Most importantly, it is can be used with my 3.5 inch LCD device that I did not have to purchase the display and controller again. As the picture shown, the indoor environment board can be plugged into the device directly.
2. Program
I have programed the device again with Arduino. It would display the value which the sensor measured, also draw a curve with the historical values on the 3.5 inch LCD. The Github link for the program: https://github.com/Makerfabs/Project_Touch-Screen-Camera/tree/master/example.
3. Test
The CO2 would sink when the air was not flowing, I put the device in a place where the height is not so high, such as the desk. And it will be meaningless to put it on the ground. I tried to take a breathing, the CO2 concentration would raise to high level, and back to the normal after moment. If check the current level and ignore the history, it would cause a mistake that the high value is the current CO2 concentration level in the air. As long as check it with the line chart which drawn with the historical values, you can easily find that is an Inaccurate number. This curve will not fluctuate too much in normal.
4. Expansion
Although this project is used to monitor the CO2 concentration level, it can be adjusted according to your wish to monitor TVOC, or temperature, or humidity. As the picture show, it collects two kind of values and draw its into the lines on the display.
5. Final
This project not only displays the current CO2 value, but also displays the historical value and draws it into a line graph, so that people can more accurately distinguish the current CO2 level at a glance. I think that is very helpful for people who are concerned about CO2 level or studying changes in CO2 levels.
6. Video Guide
If you have any question about this project or need custom turnkey PCBA service, you're welcome to leave us message to service@makerfabs.com.


